Startup Flame Chart (iOS)
Beta FeatureThis is a beta feature that needs to be enabled for your account. Contact your Emerge representative if you're interested in trying it out!
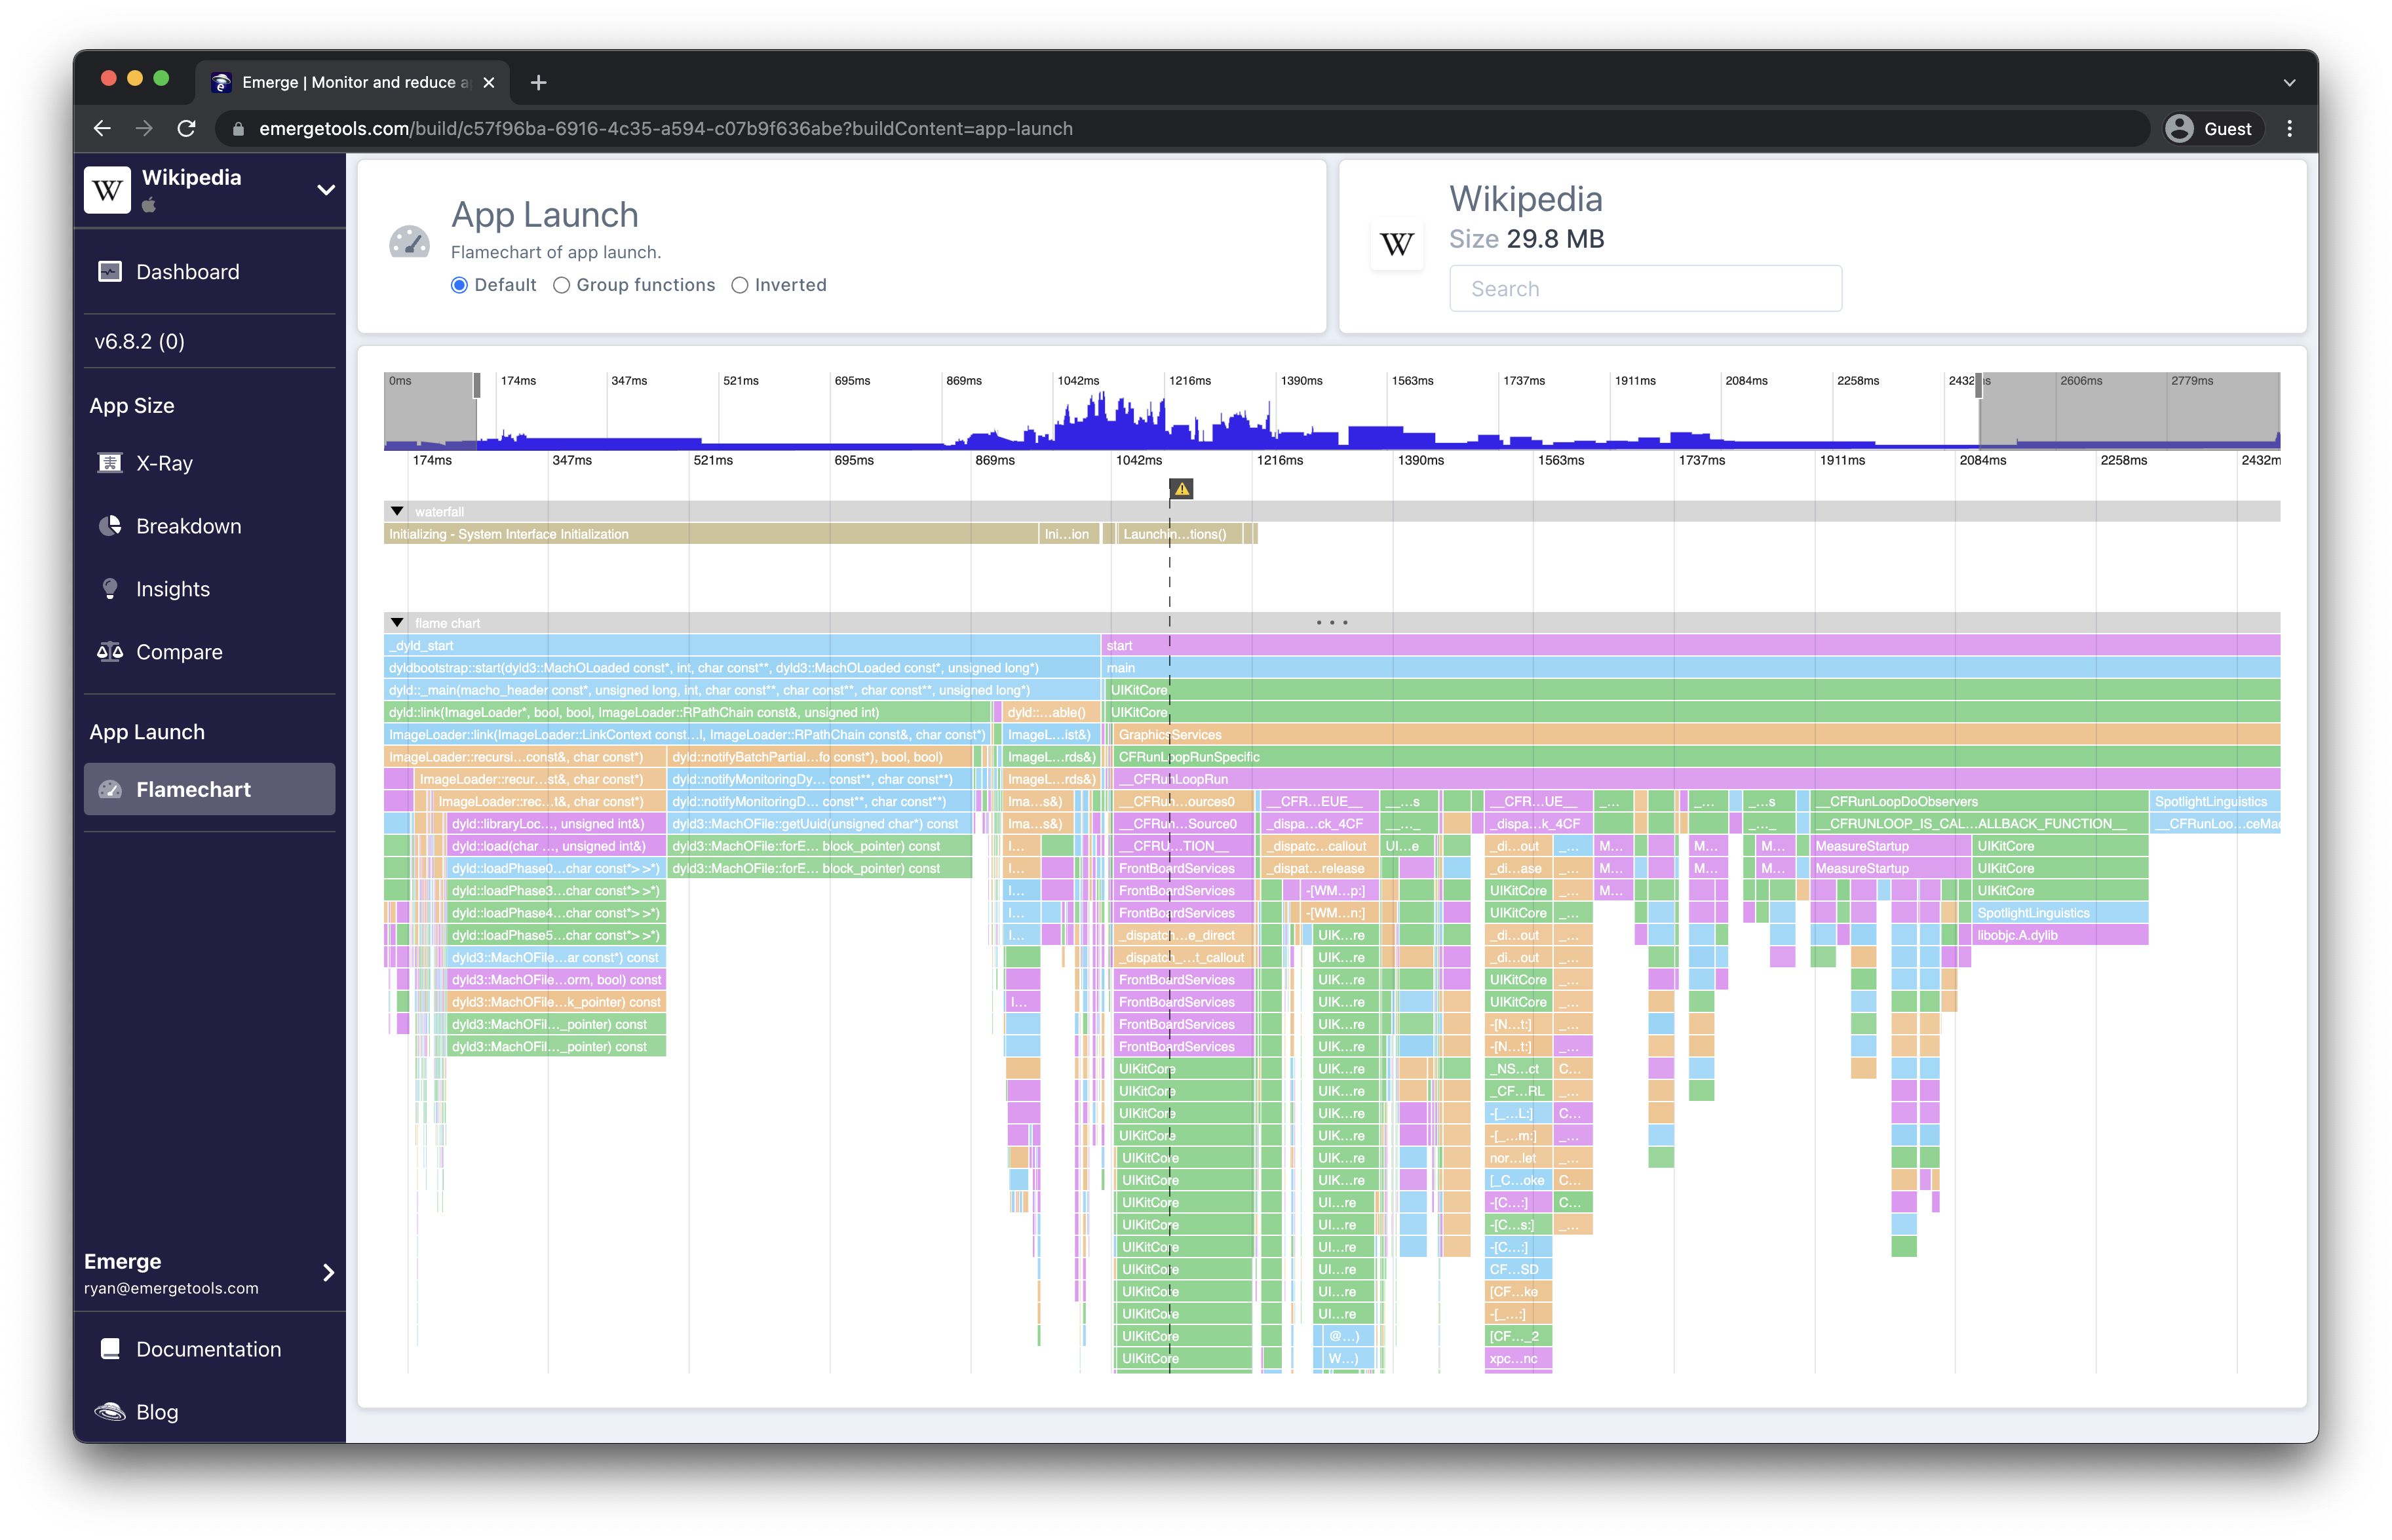
With app launch being one of the first impressions users get of your app (second only to the download/install time), it is one of the most important app health metrics. Apple recommends drawing the first frame within 400ms to keep an app from feeling slow. This is because you want your first frame rendered by the time the app open animation completes. Emerge visualizes main thread performance of app launch using a flame chart. You can use this to investigate startup performance, find the biggest blockers, and start cutting down on launch time.

Inspecting application:didFinishLauncingWithOptions: in an example flame chart.
Grouping Modes
Stack traces can be grouped in three ways.
Default
The default is a flame chart. This orders stack traces chronologically, from left to right. Samples that are in the same function get merged into one block. This is useful to understand overall flow of app launch, and identify any locations that are anti-patterns like json decoding on the main thread.
Group Functions
This mode sorts the x-axis alphabetically. All functions with the same name at the same level get merged into one node. Using this visualization highlights how much time is spent in each function, even if they are called during multiple points of app launch.
Inverted
Similar to grouping functions, but with stack traces first inverted. Using this visualization you can see how much time is spent in functions at the bottom of the call stack, often system frameworks. A common use case for this with Swift codebases is swift_conformsToProtocolImpl. This function comes from the Swift runtime and is used anytime you have a protocol conformance check such as foo as? Protocol. It's known to be slow, and could account for a large portion of app launch time. When using the inverted view these will be highlighted in red.
Graph Basics
The x axis of the graph shows time in milliseconds. Time starts at 0 with the first recorded backtrace. The Y axis shows the stack trace measured at that moment in time. The top of the stack trace is at the bottom of the page. Scroll to zoom in and out, and click and drag to pan across the chart.
Devices
App launch is always measured on a real iOS device, not a virtualized environment or simulator. This gives you the most accurate metrics reflecting what users would see in production. However, repeated uploads are not guaranteed to be on the same device, so results across uploads aren't necessarily comparable. Contact your Emerge representative if you're interested in setting up a specific device or device type.
Colors
For easy reading of the chart, each stack frame is colored. By default, the colors don't have a specific meaning, they just improve readability. Stack traces of the same name are guaranteed to be the same color. If we find common occurrences of startup time increase, the stack frame will be colored red.
Sampling
Stack traces are generated by sampling the main thread. The sampling rate is 1-5ms. This means in practice you won't see every method call, but will get a good overall view of what work is being done during app startup.
Waterfall
The graph is annotated with lifecycle events that were found during app launch. The first ones occur while the system initializes your app's runtime. This includes work done in dyld to setup the binary and any static initializers in your code such as +load methods. Next is the UIKit lifecycle such as applicationDidFinishLaunching.
Note that because stack traces are sampled you might see a few milliseconds of time between the lifecycle event start and the first stack trace containing methods related to that event.
Points of Interest
Annotations in the graph mark stack frames we found that indicate decoding being done on the main thread. It's considered best practice to decode on a background thread to not block app interactivity, and decrease overall startup time. Once we find a stack frame corresponding to json decoding we color it and all the ancestor nodes in red. Note these annotations only show in the default visualization mode.
Search
The search box in the top right of the page does a cat-insesitive search for substrings of each stack frame. Matches will retain their color, but frames not matching change to gray.
Trace end time
Likely to changeWe'll likely be making changes to this implementation as the feature exits beta, check back soon for updates!
We monitor the main runloop of your app to detect when app launch has finished. When the main runloop has been free for 400ms we'll terminate the app, otherwise launch will timeout after 5 seconds. Contact your Emerge representative if you'd like to set specific conditions for measuring the end of app launch.
Updated about 1 month ago