Performance Profile
Performance profiles are designed to quickly assess the performance of your app's startup by running launching it on a physical device and measuring its performance.
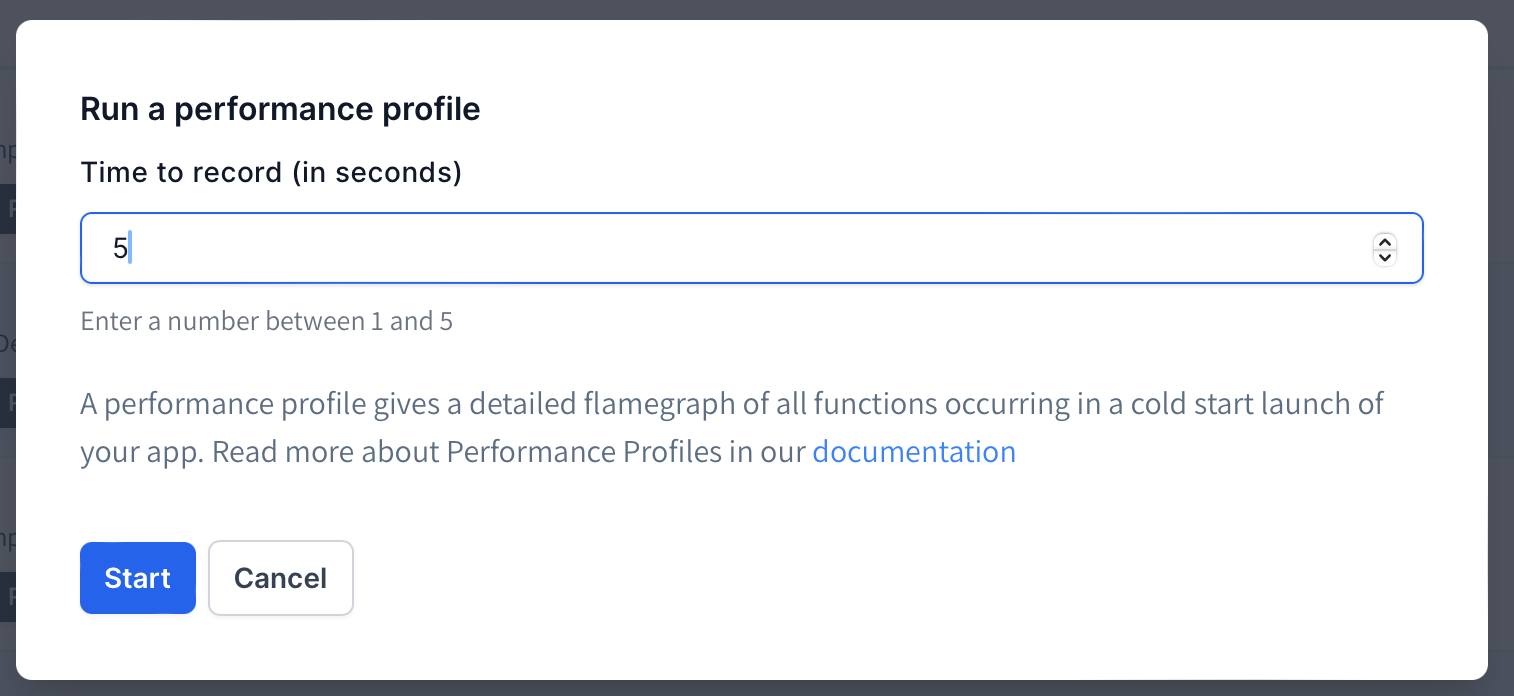
- On iOS, Emerge will launch your app and run for a desired duration (in seconds - default 1s)
- On Android, Emerge will launch your app and profile to the end of the first frame render.
Performance Profile vs Performance Comparison
Performance Comparisons provide a rigorous runtime comparison between two builds. Where a Performance Comparison may run the app up to 100 times to provide a statistically significant comparison, Performance profiles only runs the app once, providing a quick and accurate profile of your app's startup.
Run a performance profile
You can run a performance profile for any upload you've made to Emerge.
Profile page
On uploads that are eligible for a performance profile, the performance profile page (https://emergetools.com/performance/<upload_id>) will have a button that will trigger a performance run.
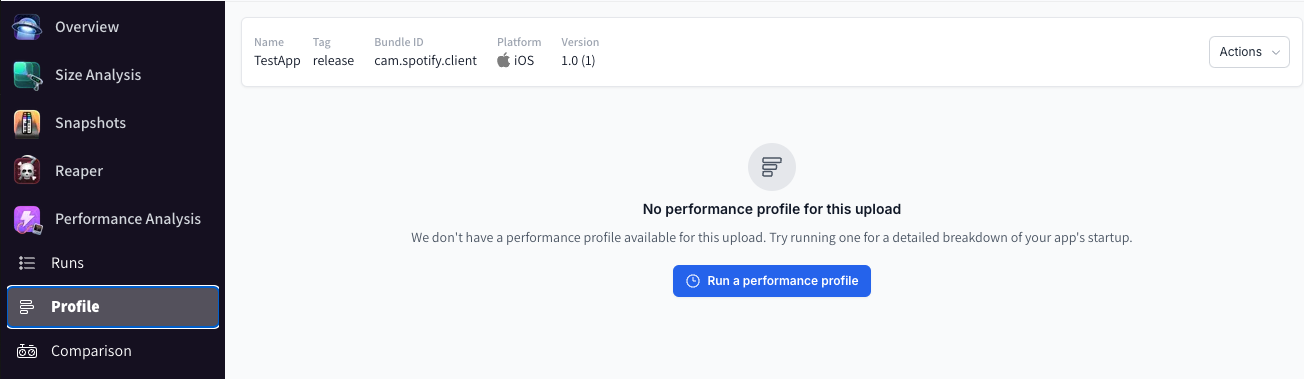
On iOS, this will prompt you to enter a duration to profile. On Android, Emerge will profile from process start to end of first frame.
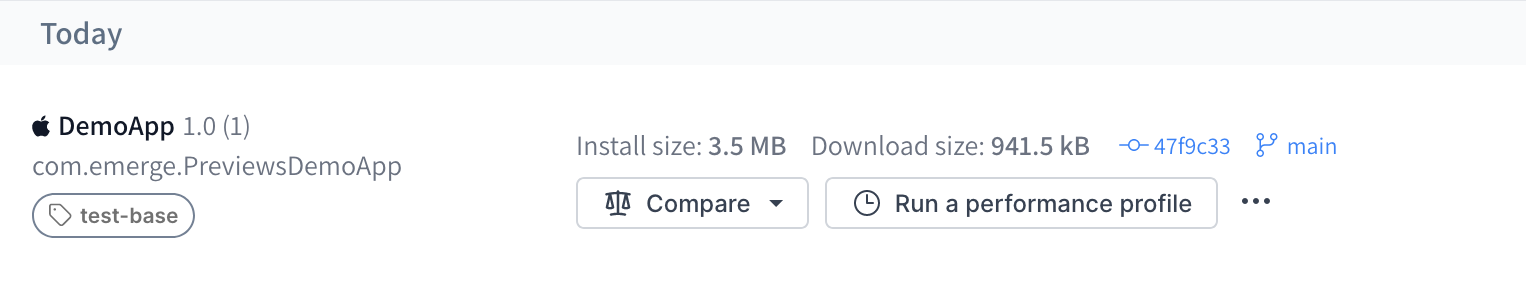
Uploads page
You will see a button under each upload that's eligible for a performance profile in the uploads page:
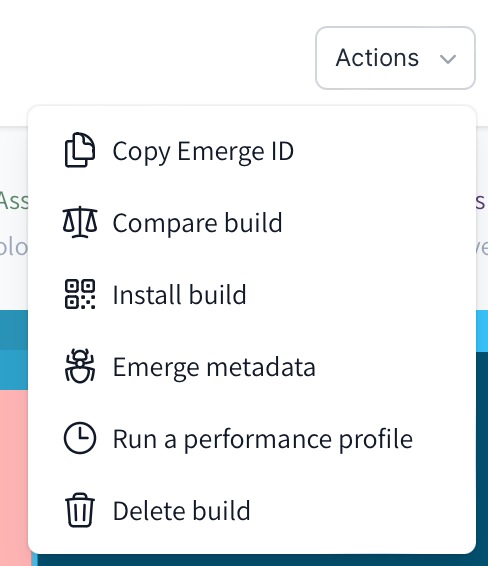
You can also open the modal from any upload page from the Actions Button on the top right:
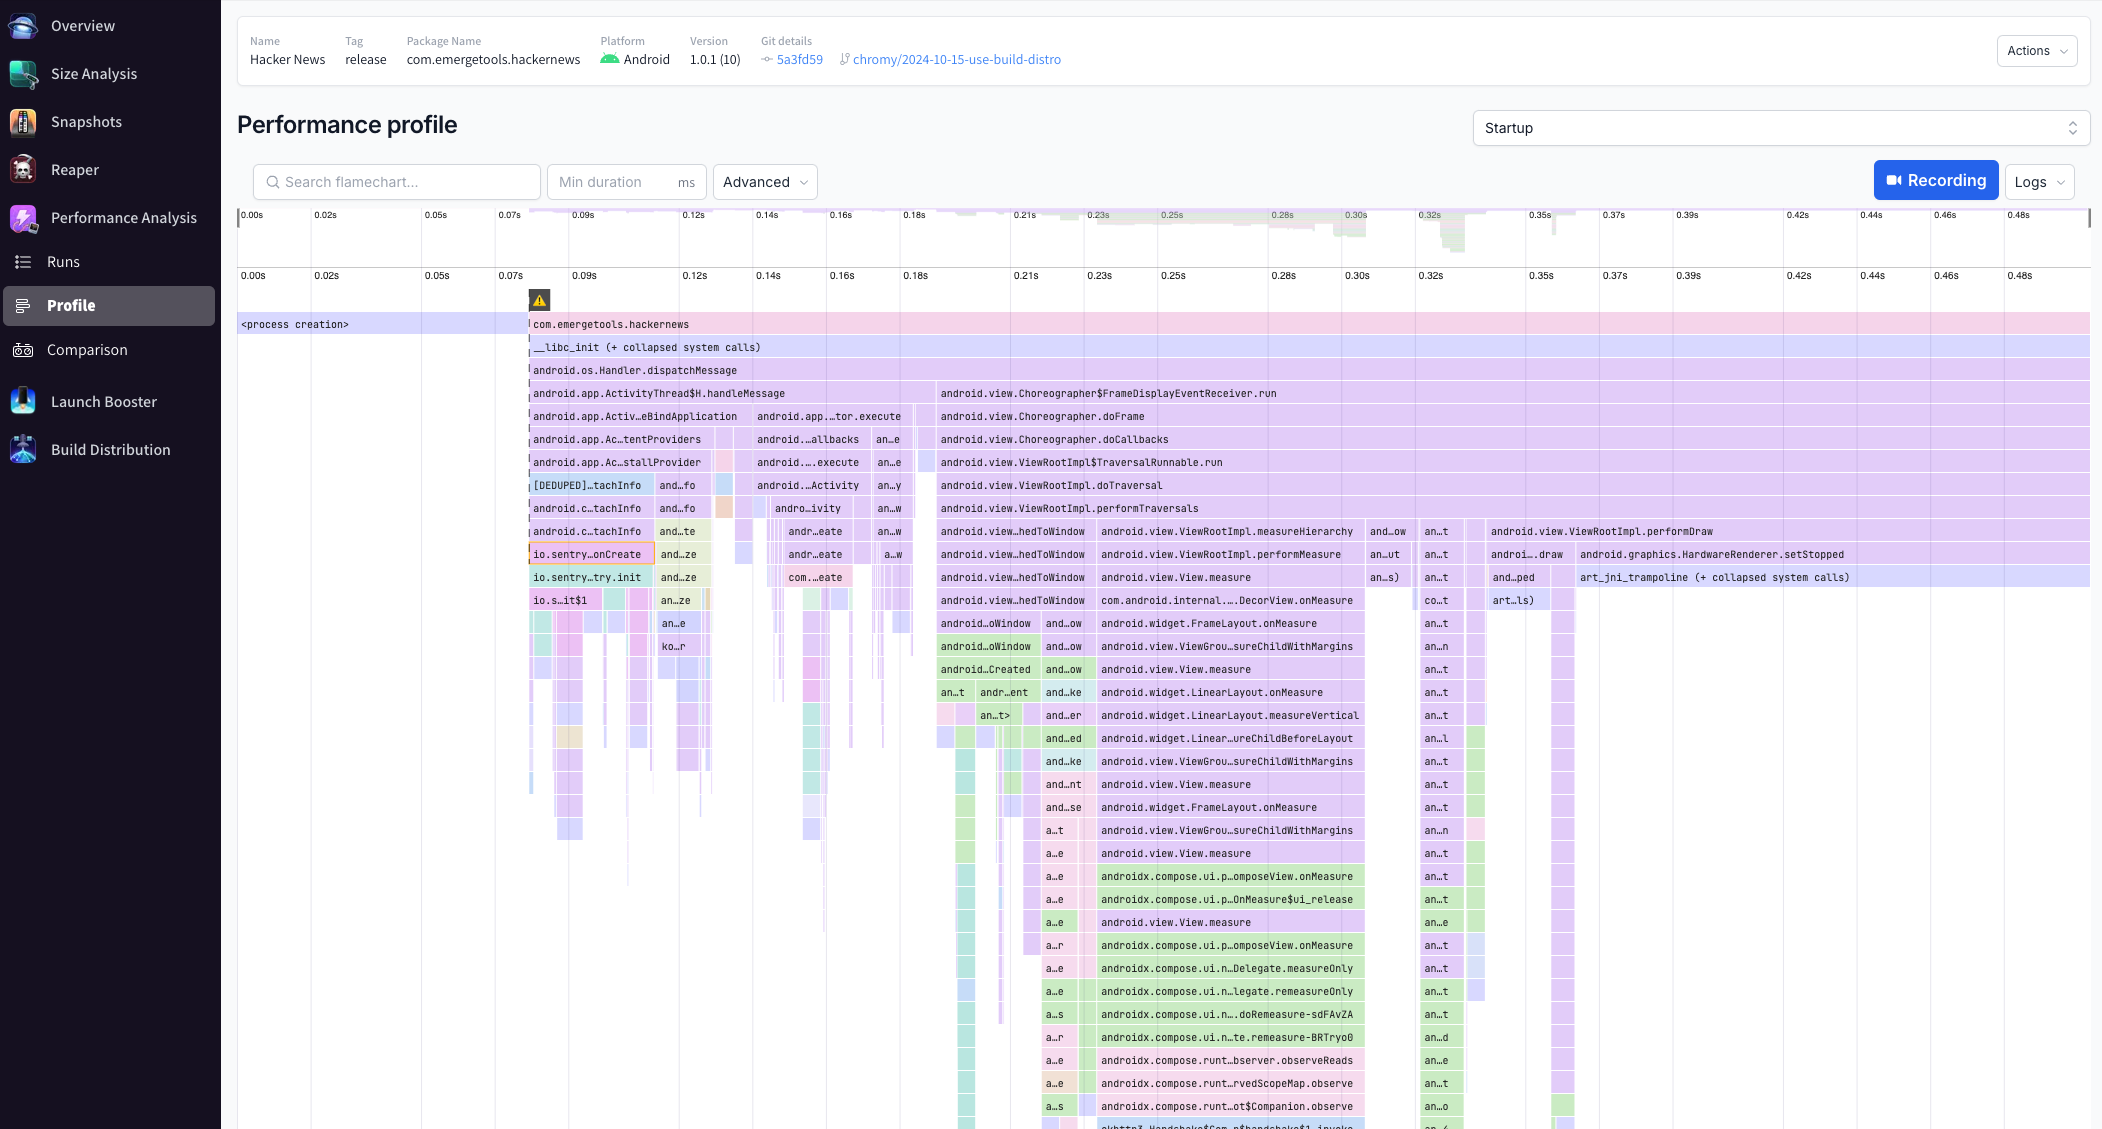
Viewing results
Performance results can be found on an upload's performance profile page (https://emergetools.com/performance/<upload_id>). Profiles usually take ~5 minutes to run.
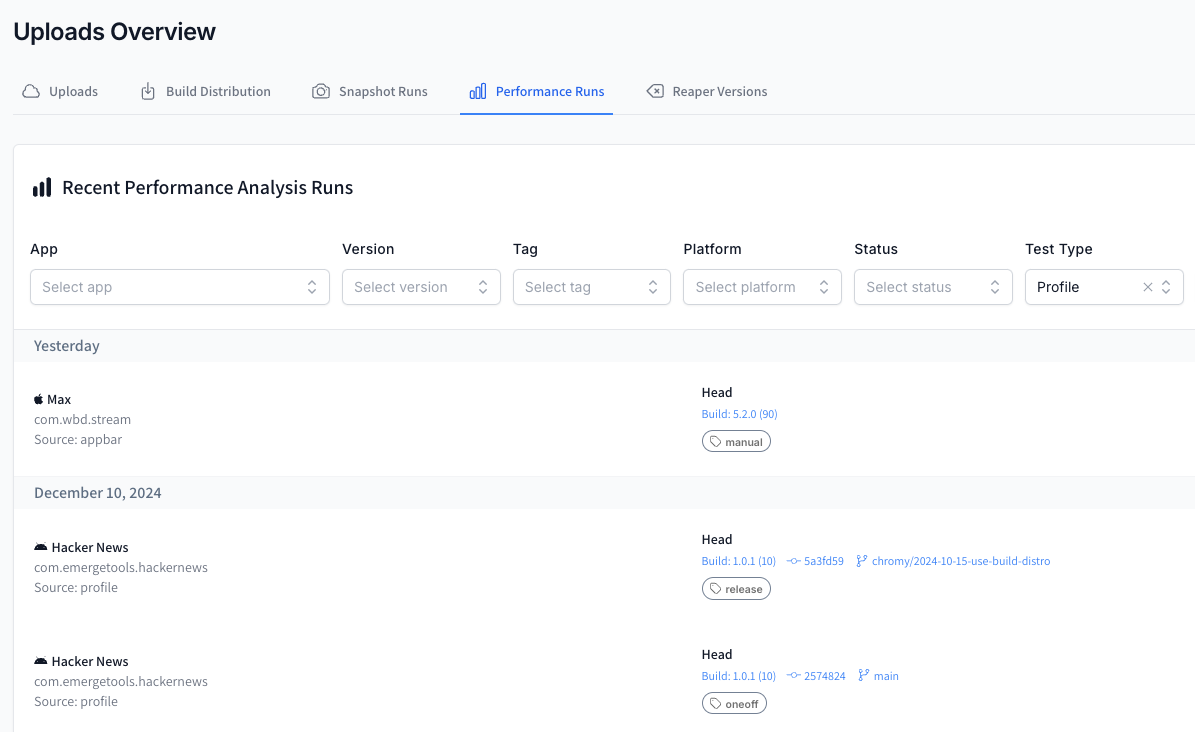
Viewing all performance profile runs
You can see the ran profiles in the Performance Runs tab. Select the "Test type" dropdown and select "Profile" to see just performance profiles.
FAQ
How can I detect in code if my app is actively running in a performance profile?
A flag/env variable is set on each platform that can be queried from the app at runtime to run/avoid certain areas of code.
Android
The system property debug.emergetools.is_perftest will be set to 1 during a performance profile.
iOS
The environment variable EMERGE_IS_PERFORMANCE_TESTING will be set to 1 during a performance profile.
Can I run a custom test to profile over?
At this moment, custom tests are not supported in performance profiles for both iOS & Android.
Custom tests are supported with Performance Comparisons.
Updated 5 months ago