Custom Flow Performance Analysis (Android)
This guide assumes you have already added and configured the Emerge Gradle plugin to your Android project and that you are using Android Studio or IntelliJ.
Looking for custom startup scenarios?This guide is for testing custom flows within the app.
For testing custom startup scenarios, see Custom startup scenarios, startup scenarios require different measures for accurate results, and therefore requires slightly different setup.
General concepts
Emerge's performance analysis focuses on catching performance differences between app builds. To do so, Emerge controls many sources of noise and variance on the real, physical device we test on to ensure any performance difference between the two comparison builds stems from the app builds alone.
UI testing
Emerge custom flow performance analysis relies on UIAutomator UI tests executing from a separate, standalone test APK against the target application. These tests must run in a separate process to ensure they are not directly affecting the performance of the target application.
Currently, custom flow performance analysis is only supported for AABs. Should your team need to test against APK(s), contact us through your dedicated Slack channel or email us.
Emerge's Gradle plugin takes care of the heavy lifting of setting up and managing this separate test APK for you. Follow the guide below to get up and running in ~10 minutes.
Quick start (~10 minutes)
Create a performance testing subproject
First, let's set the performance subproject path in the Emerge Gradle plugin configuration. This is where you can choose its name. Here we use performance as an example:
emerge {
  performance {
    projectPath.set(":performance") // Does not need to exist, we'll create it soon!
  }
}
Next, we'll generate the subproject and choose its package name:
./gradlew :app:emergeGeneratePerformanceProject --package com.myapp.performanceThis creates the subproject with an example performance test and adds it to settings.gradle(.kts):
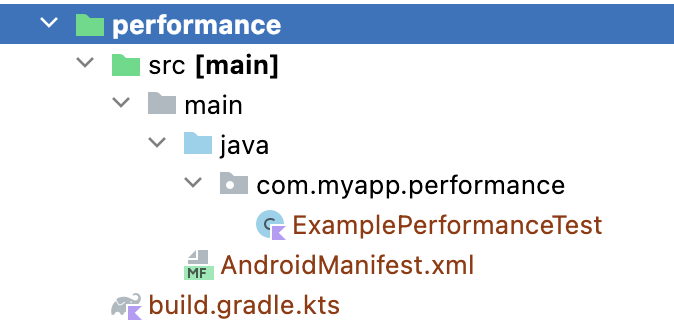
"Sync Project with Gradle Files" for your IDE to recognize the new subproject.
Write your first custom performance test
Open the newly generated ExamplePerformanceTest file. The Emerge SDK provides method annotations that work similarly to the JUnit annotations you may be used to:
@EmergeTestdefines performance test methods. Each test method is run multiple times on an isolated device in order to detect significant performance changes. Typically this is where you would launch your app or perform an operation whose performance is critical.- The
@EmergeSetupmethod is executed once before each test iteration. It is optional and is typically used to navigate to the screen where the performance testing should start. Only one setup method per class is allowed. - The
@EmergeInitmethod is executed just once after the app is installed. It is optional and is typically used to log into the app, if needed. Only one init method per class is allowed.

Similar to startup testing, Emerge will record disk state from base, as well as network traffic from base and head and replay across future iterations to ensure consistency.
Use of the Espresso testing framework is strongly discouraged as it can significantly degrade performance during tests. Please use UI Automator or UI Automator-based libraries like Relax instead.
Edit the ExamplePerformanceTest file to perform an operation that needs to be and remain performant. You are free to rename the class or create multiple test classes.
Isolated testingEach test runs on a different device so they cannot impact each other.
Verify performance tests locally
Emerge goes to great lengths to make performance tests reliable, like using one real device for each test, running every test dozens of times, etc. As such it is not possible to run a true performance test on your local machine. However, it is possible to run your performance tests locally to ensure that they are set up correctly and can complete successfully:
./gradlew :app:emergeLocalReleaseTestNote: You must have a single emulator or physical device connected and available though adb for local testing.
At the end of the Gradle output you will find the verification results:
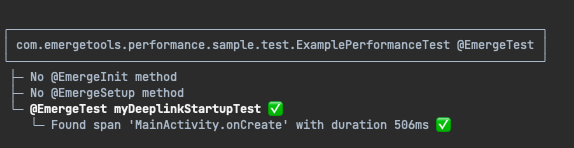
The local performance debugging will run your tests exactly as they'll run on Emerge devices. As of version 2.1.0 of the performance SDK (com.emergetools.test:performance), Emerge will also detect custom spans specified in the @EmergeTest(spans = [...]) spans array for each test and alert you if they were successfully found in the target application.
Run performance tests on Emerge's cloud testing suite
This step requires getting in touch with our team to get set up!
Custom startup scenarios
2.X+ RequiredCustom startup scenarios were introduced in version 2.0.0 of the Emerge perf testing SDK. See the emerge-android repository for the lastest version info.
Emerge supports custom startup scenarios for apps that require more complex startup scenarios, like launching from deep links or other entry points. For custom startup scenarios, use the @EmergeStartupTest annotation with a custom startup test method:
class MyCustomStartupPerformanceTest {

  @EmergeInit
  fun login() {
    // OPTIONAL - Perform one-time setup, like logging in
  }

  @EmergeStartupTest
  fun customStartupTest() {
    // Ex: Launch app from deeplink or other entrypoint
  }
}
Emerge will run the @EmergeInit method once after the app is installed, then run the @EmergeStartupTest method multiple times on an isolated device in order to detect any potential performance regression.
Note: For custom startup tests, any@EmergeSetup annotated methods will not be run as their purpose is not relevant for startup scenarios.
Performance testing specific spans
By default, Emerge will measure the performance of your overall UI test's duration.
If specific measurements are desired, Emerge's performance testing can measure the duration of specific spans from your app, leveraging Android.Trace|AndroidX.Trace functionality to mark the start and end of specific spans.
Specifying spans requires adding tracing code to the app you're measuring the performance of, using stock Android|AndroidX tracing functionality.
1. Wrap the code you wish to measure in a Trace call:
Trace call:From your app's source code, you'll need to mark the start and end of any trace using Android.Trace or AndroidX.Trace calls.
Emerge expects exactly one start/end for any specified span.
import androidx.tracing.trace

class MainActivity {

  override fun onCreate(savedInstanceState: Bundle?) {
    trace("main_activity_init") {
      initMyActivity()
    }
  }

  fun initMyActivity() {
  	// Performance sensitive code we want to measure
  }
}
2. Specify the span name(s) to Emerge to record.
Emerge needs a way to find your desired span, which can be provided as part of the span parameter to the @EmergeTest annotation.
class MainActivityInitTest {

  @EmergeTest(spans = ["main_activity_init"])
  fun test() {
    // Example launching with Emerge's Relax library: https://github.com/EmergeTools/relax
  	Relax("com.example.myapp") {
      pressHome()
      launch()
    }
  }
}
Note: Each span must be present in both the base and head for a perf test to be successful. Emerge recommends merging the introduction of the span in the target app before merging test changes, to ensure both base & head both can detect the span.
That's it! Emerge will automatically measure any specified spans measured from your UI test.
Spans can be sensitive to variancePerformance testing specific spans can lead to measuring spans that are far shorter than longer-duration performance measurements, such as app launch.
For example, if Emerge is measuring a span that usually takes about 10ms in the first iteration, then 12ms in the second test, a seemingly small 2ms variance appears to be a 20% regression in the performance of this span. Compare this to a longer measure like app launch, where a 500ms vs a 502ms app launch duration appears to be a 0.4% regression, which Emerge's statistical measures will determine the 2ms change to be noise.
Emerge goes to great lengths to reduce variance of performance tests and use statistical measures to avoid noise influencing measurements, but it's impossible to control all sources of variance. Therefore, if using spans as the primary form of measurement, we highly recommend the spans be sufficiently long to avoid exposure to small variance in measurements.
Recording custom metrics
Emerge allows custom metrics to be recorded from your performance tests and exposed through the /getPerfTest API endpoint. Custom metrics will be presented as-is in the userInfo field if present in the performanceTests array objects.
To save custom metrics, from your test, save a JSON file named metrics.json to your test app's storage directory obtained using context.getExternalFilesDir(null).
class MyPerformanceTest {

  @EmergeTest
  fun myPerformanceTest() {
    // ...

    IntrumentationRegistry()
      .getInstrumentation()
      .context
      .getExternalFilesDir(null).let {

        val json = JSONObject().apply {
     	    put("my_custom_metric", "myCustomMetric")
      	}

        val file = it?.resolve("metrics.json")
        file?.writeText(json.toString())
      }
  }
}
Custom metrics must be namedmetrics.json!Emerge will not pick up custom metrics if not present in the default test app directory (available from
getExternalFilesDir(null)and explicitly namedmetrics.json.
Emerge will automatically pick up this file and save the raw JSON in the userInfo field available in the performanceTests array from the /getPerfTest endpoint. These metrics are not exposed in Emerge's UI.
Custom metrics are supported per test. Any custom metrics found during a test will be added to all spans within the test.
Potential performance implicationsSaving a file during a performance test can introduce variance, as I/O operations could affect the test duration. If saving custom metrics, Emerge suggests using custom spans as the primary measurement rather than the duration of the whole test (default). Information about custom spans is available in the Performance testing specific spans section.
Updated 5 months ago