Monitoring Network Requests
Emerge's performance analysis records and replays all network traffic for the app being profiled to ensure no variance between test iterations. Emerge also exposes this network information as part of perf testing results in the Emerge UI under the "Network" tab.
By tracking the network activity, users can gain insights into how different builds (base and head) impact network requests & understand the total network activity for a given build.
Request Table
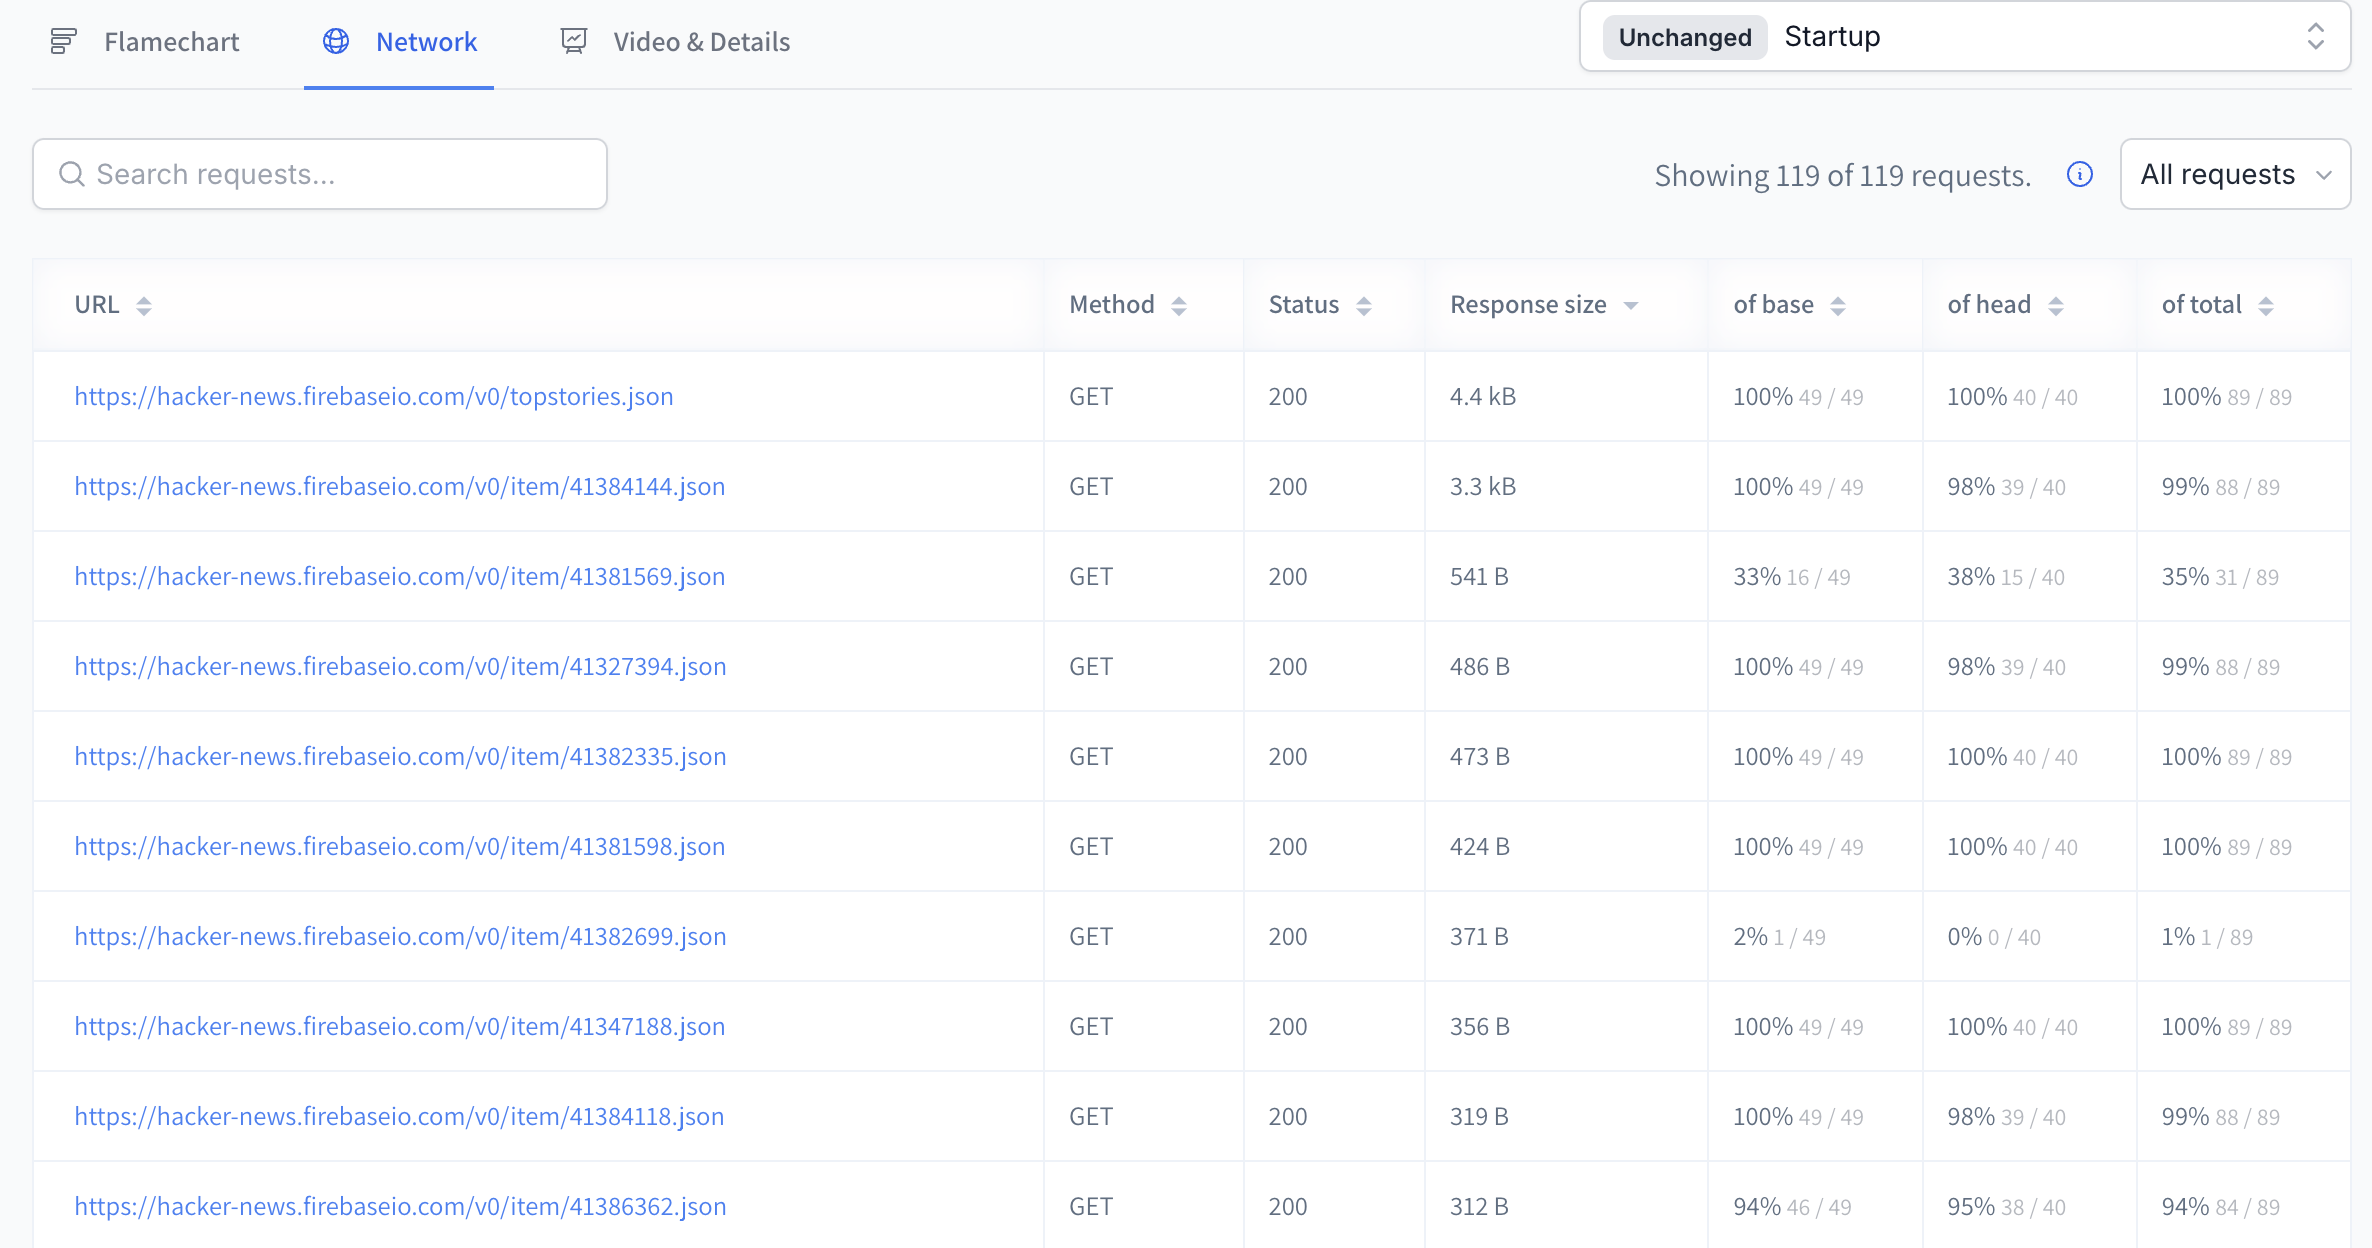
The Network Table captures every network request made during the test span. For each request, it records the HTTP method, status code, response size, and the number of times the request appeared across the base and head build iterations.
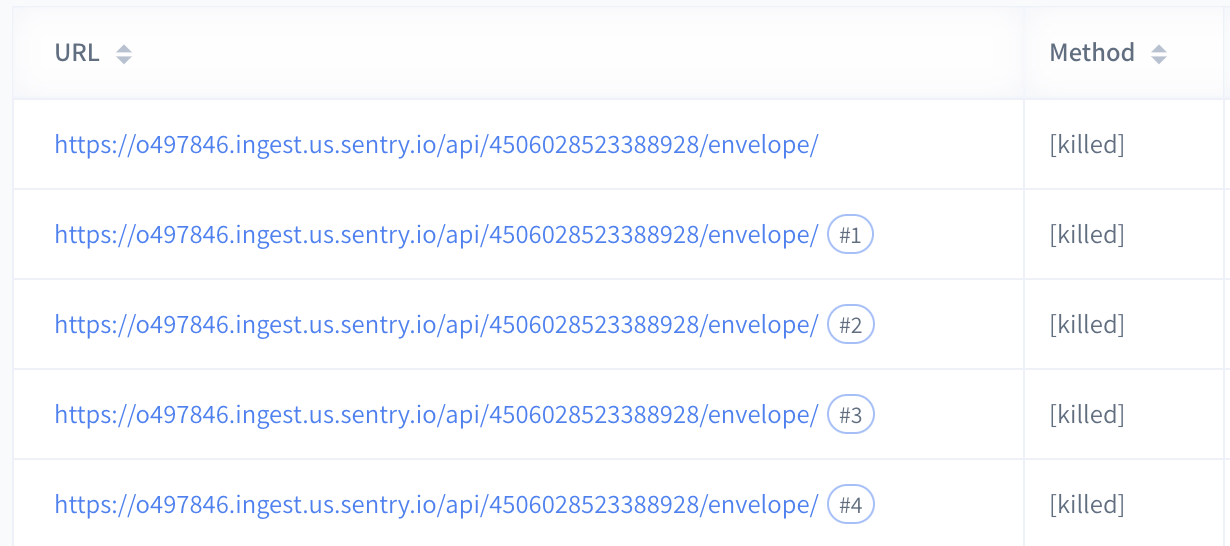
A single request may be seen multiple times in a single iteration. If this happens, Emerge will display a badge next to the request with a count of total number of times this call was seen.
Filters
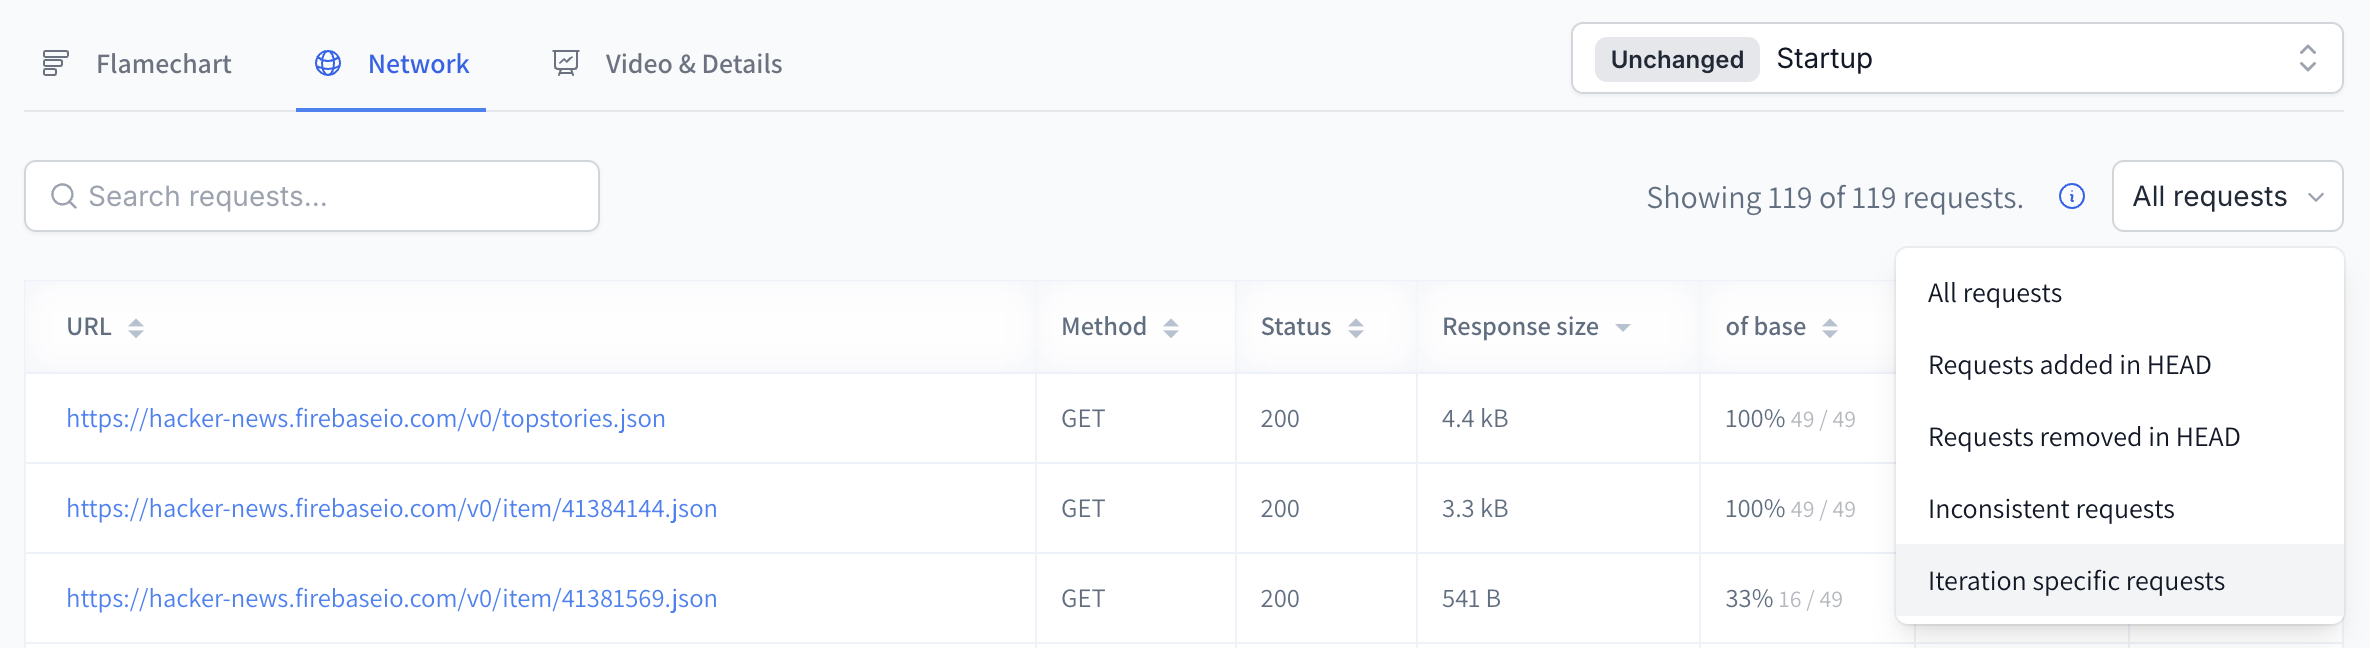
- All Requests: Displays every network request captured during the performance test, without any filtering.
- Requests Added in Head: Shows requests that are present in 100% of the head build iterations but are absent in the base build iterations.
- Requests Removed in Head: Displays requests that were present in 100% of the base build iterations but are absent in the head build iterations.
- Inconsistent Requests: Lists requests that appear in more than one iteration but not in all iterations.
- Iteration Specific Requests: Highlights requests that appear in only a single iteration, indicating one-off or rare requests.
Updated 5 months ago