Viewing Perfetto Traces
This is currently an Android-only feature
This feature allows users view and download Perfetto traces of specific test iteration runs. By looking at a much more detailed view compared to the differential flame graph in the Emerge UI, users can dive deeper into what could be responsible for regressions or improvements in app startup time.
Viewing a trace in Perfetto
Emerge uses Google Perfetto to provide deeper insights into how your android app is running. To view the Perfetto analysis, click on the Traces dropdown in the Performance Comparison page and select which trace you'd like to see (base or head).
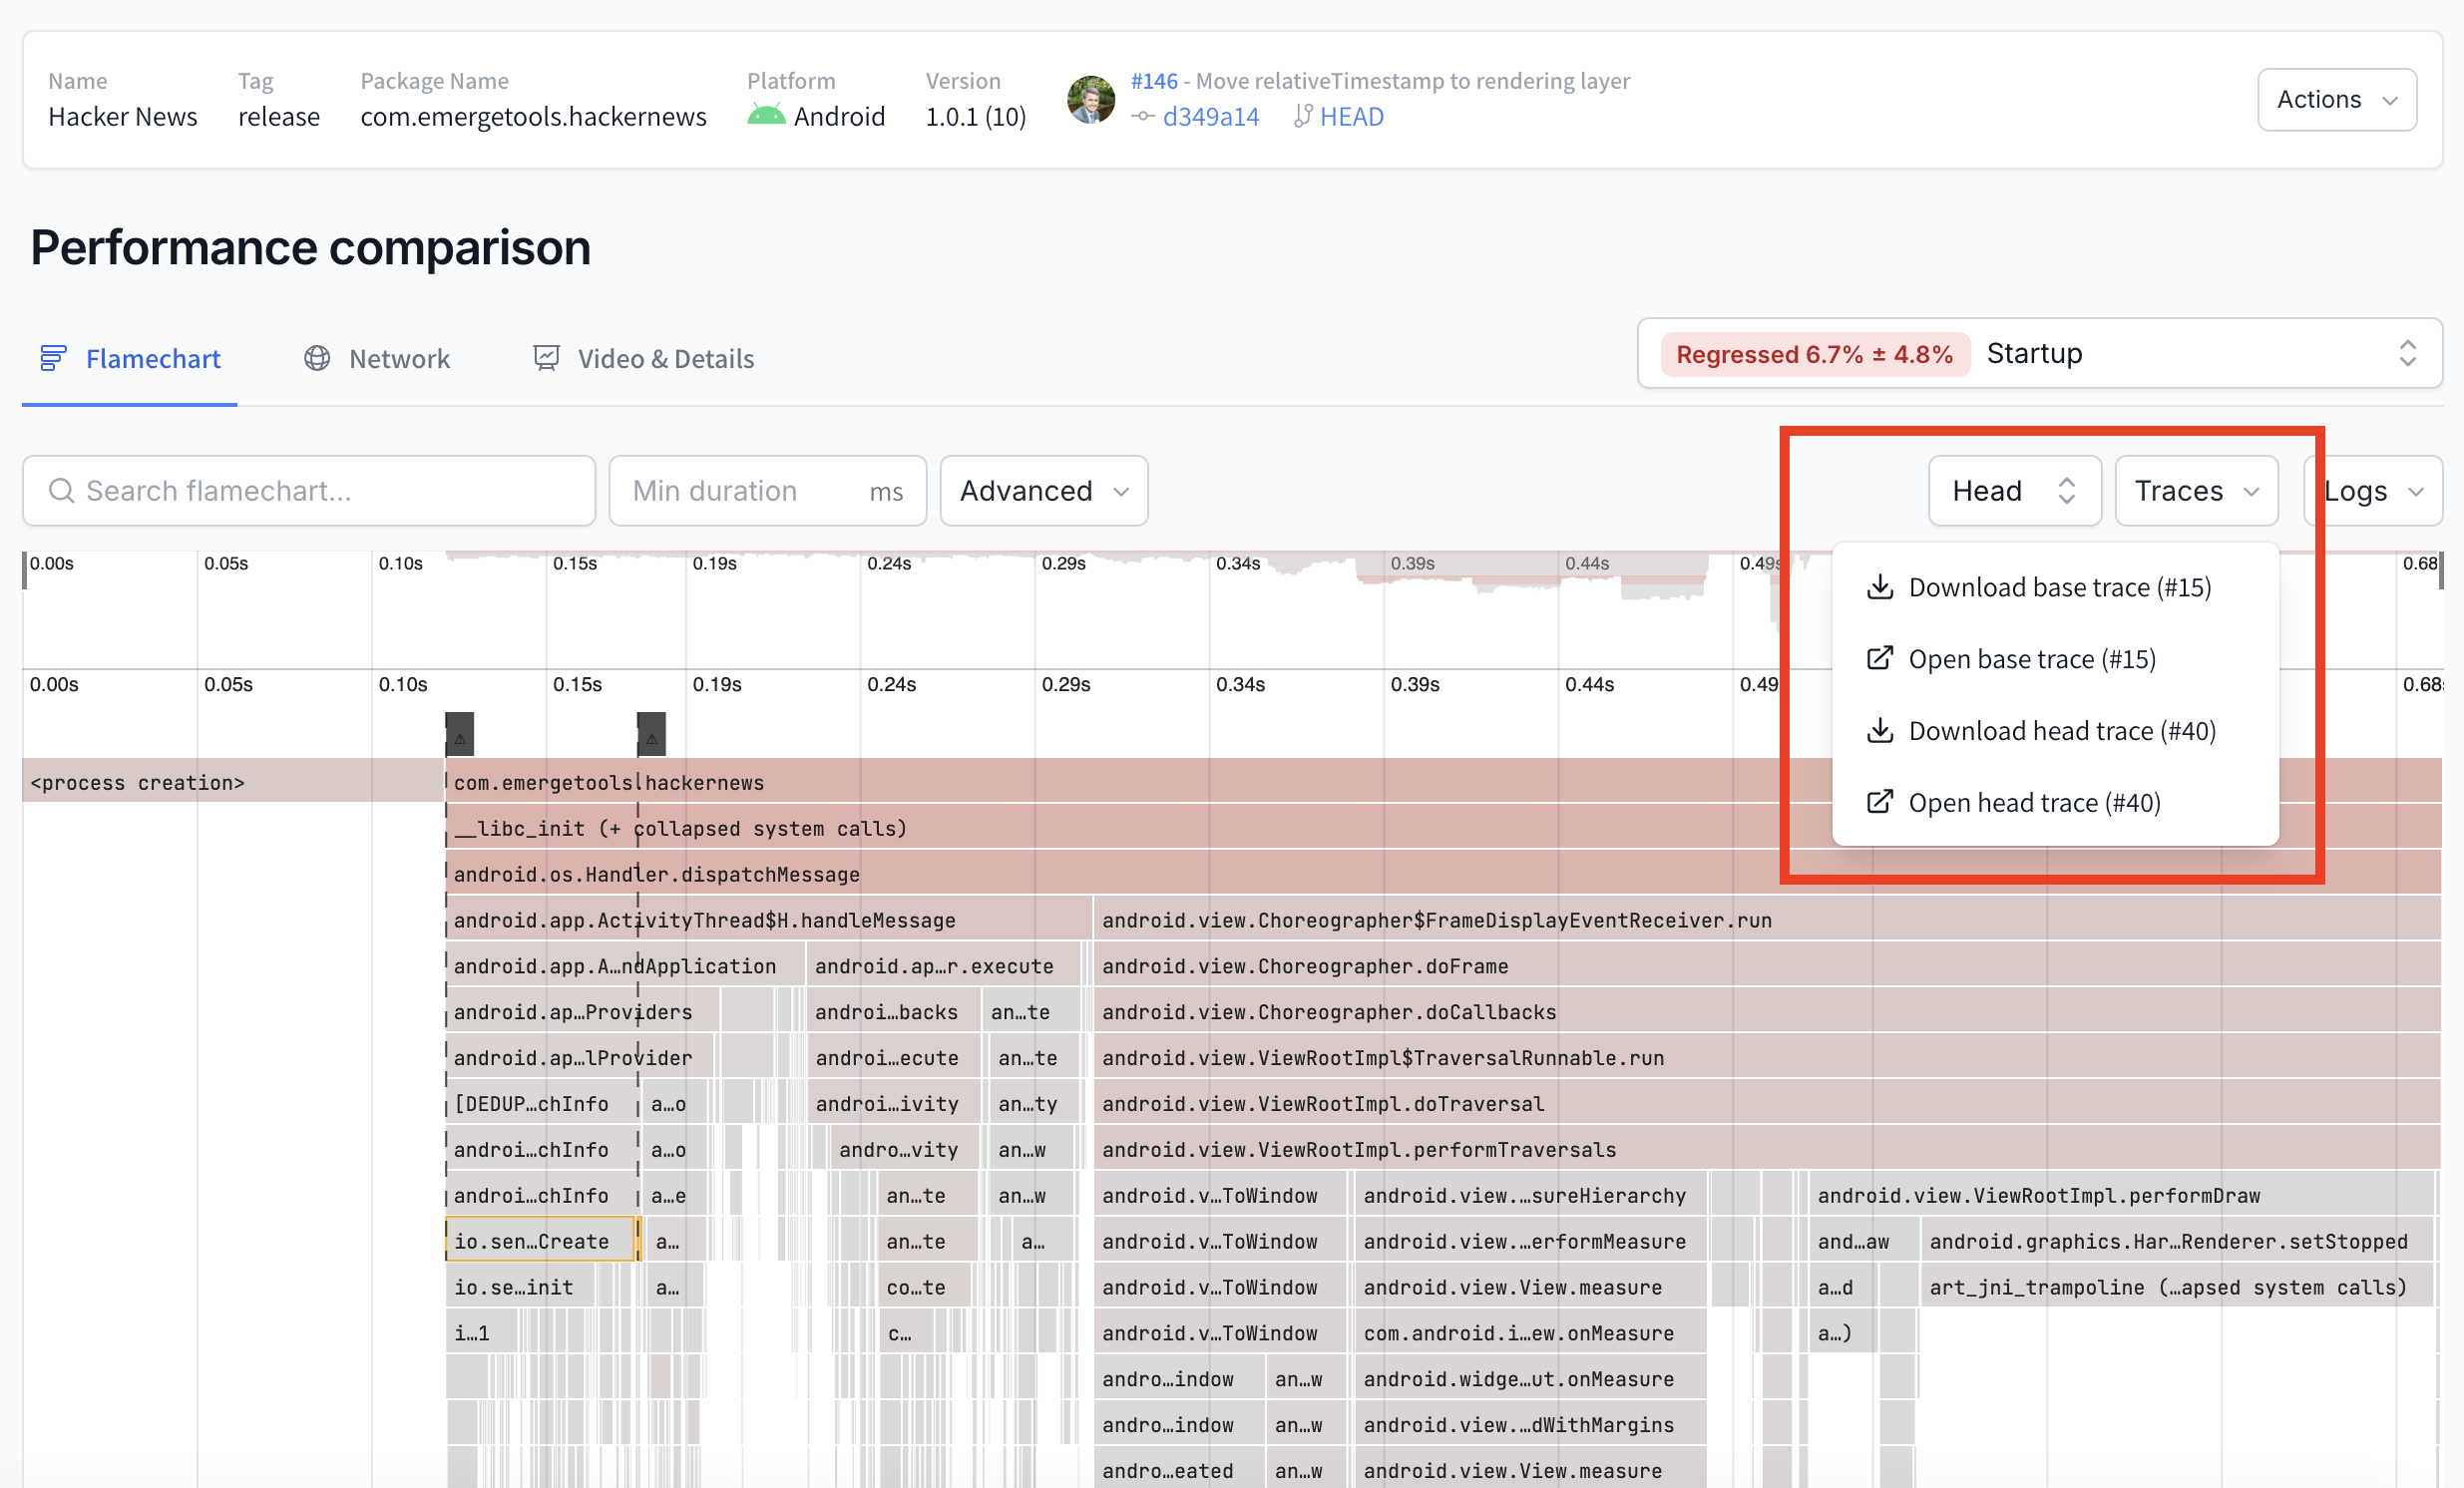
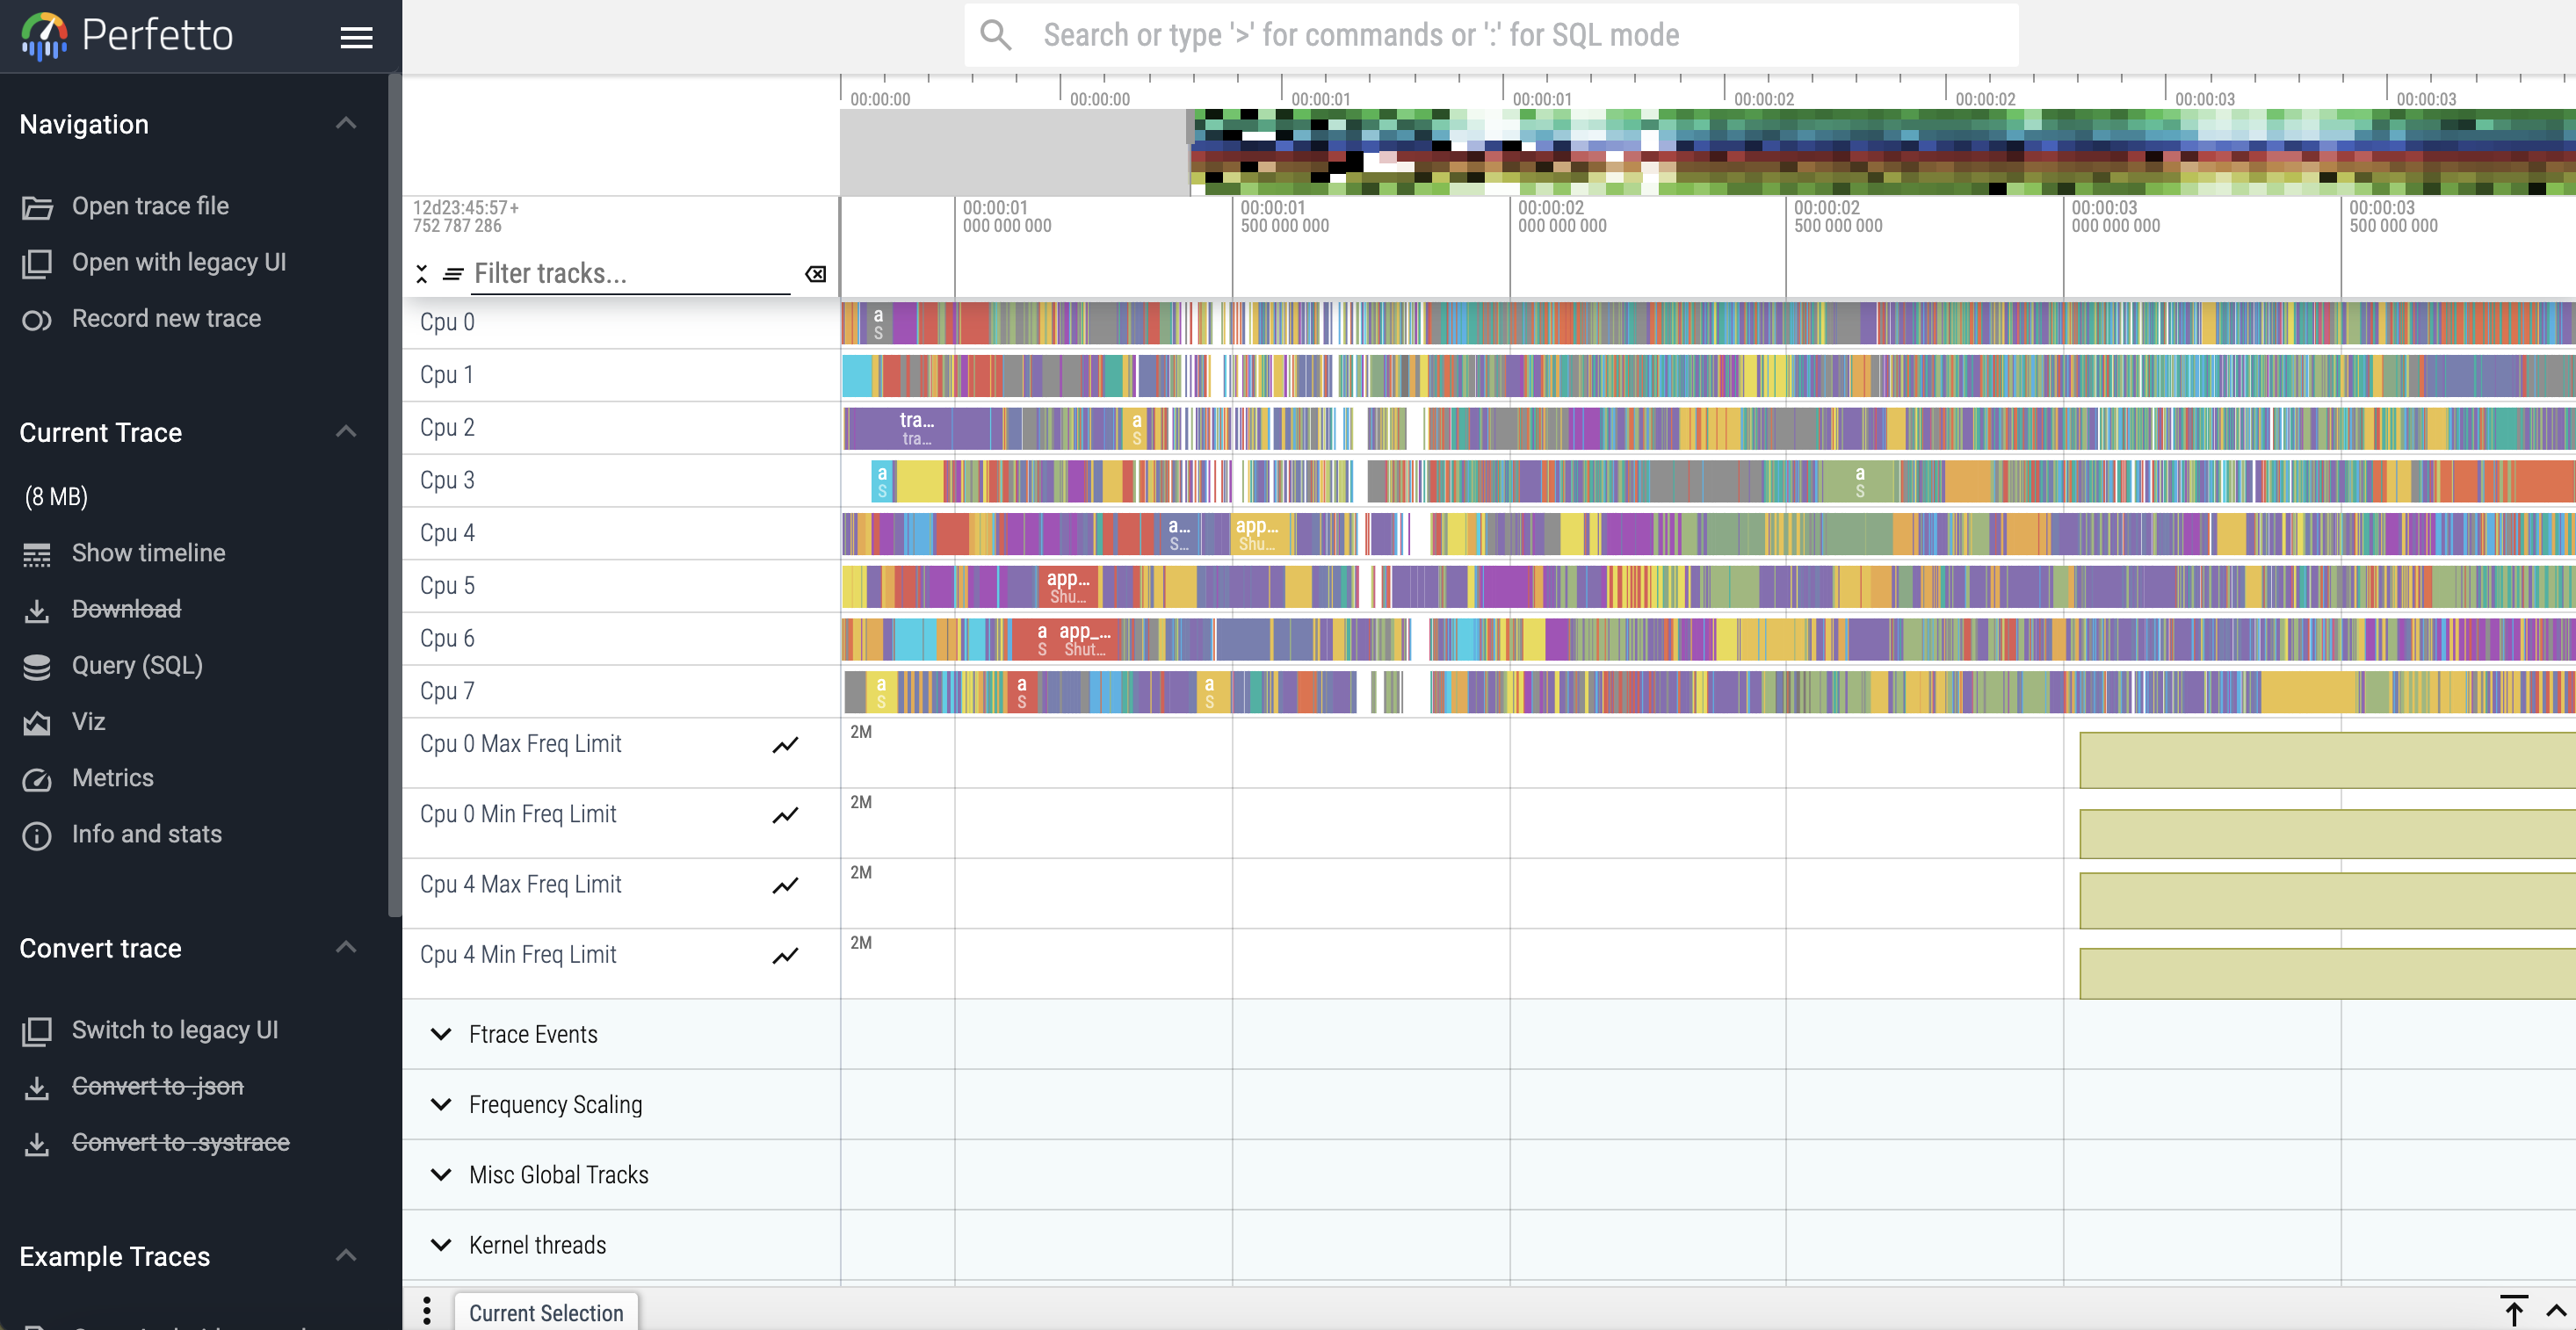
You'll then be guided to open the trace in Perfetto where you can view the detailed trace analysis for your app.
Downloading traces
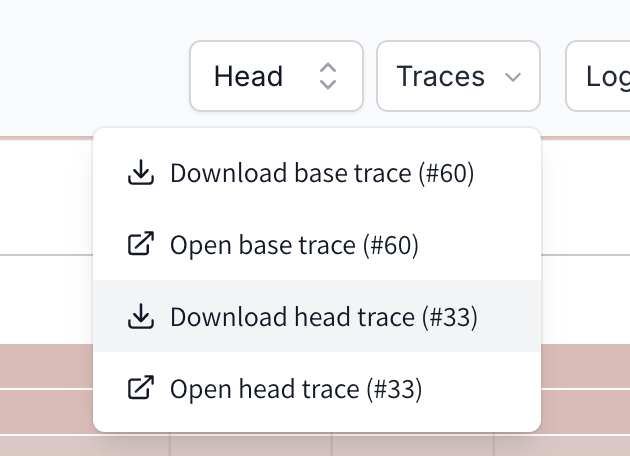
To download a trace, select which build you want to download from the Traces dropdown. You can view the trace file by uploading it to https://ui.perfetto.dev/ or by running trace_processor_shell locally (instructions here)
Selecting specific traces
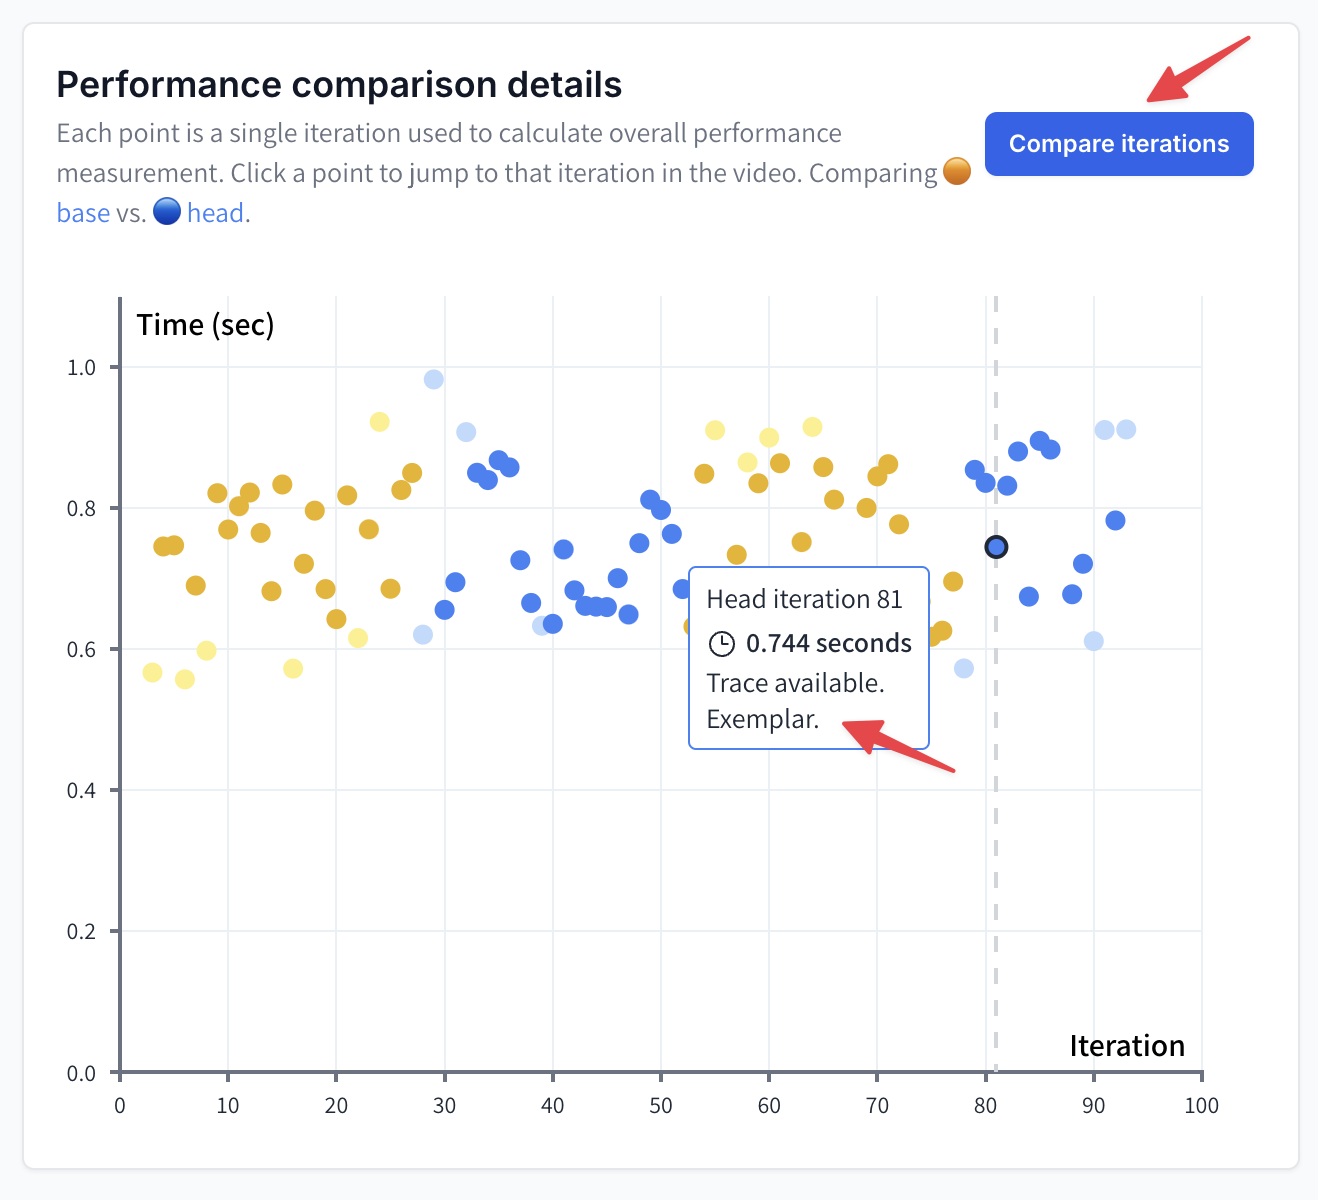
By default Performance Analysis selects an a single exemplar iteration from the base build and the head builds and displays the traces for those iterations. The 'Compare iterations' feature can be used to select specific traces to download or open.
Downloading traces via the REST API
Traces can also be downloaded via the REST API. See the API documentation for more information.
curl --request POST \
     --url https://api.emergetools.com/trace \
     --header 'accept: application/json' \
     --header 'content-type: */*' \
     --data '{"spanId":"span_mySpan","iteration":42}'
Updated 5 months ago