ETTrace (iOS)
ETTrace gives you access to easy to use and powerful performance visualizations entirely locally.
Profiling locally relies on two components. First, the ETTrace SDK needs to be linked to your app. Second, the CLI needs to be installed on your computer. Detailed installation instructions for iOS are available on the repo.
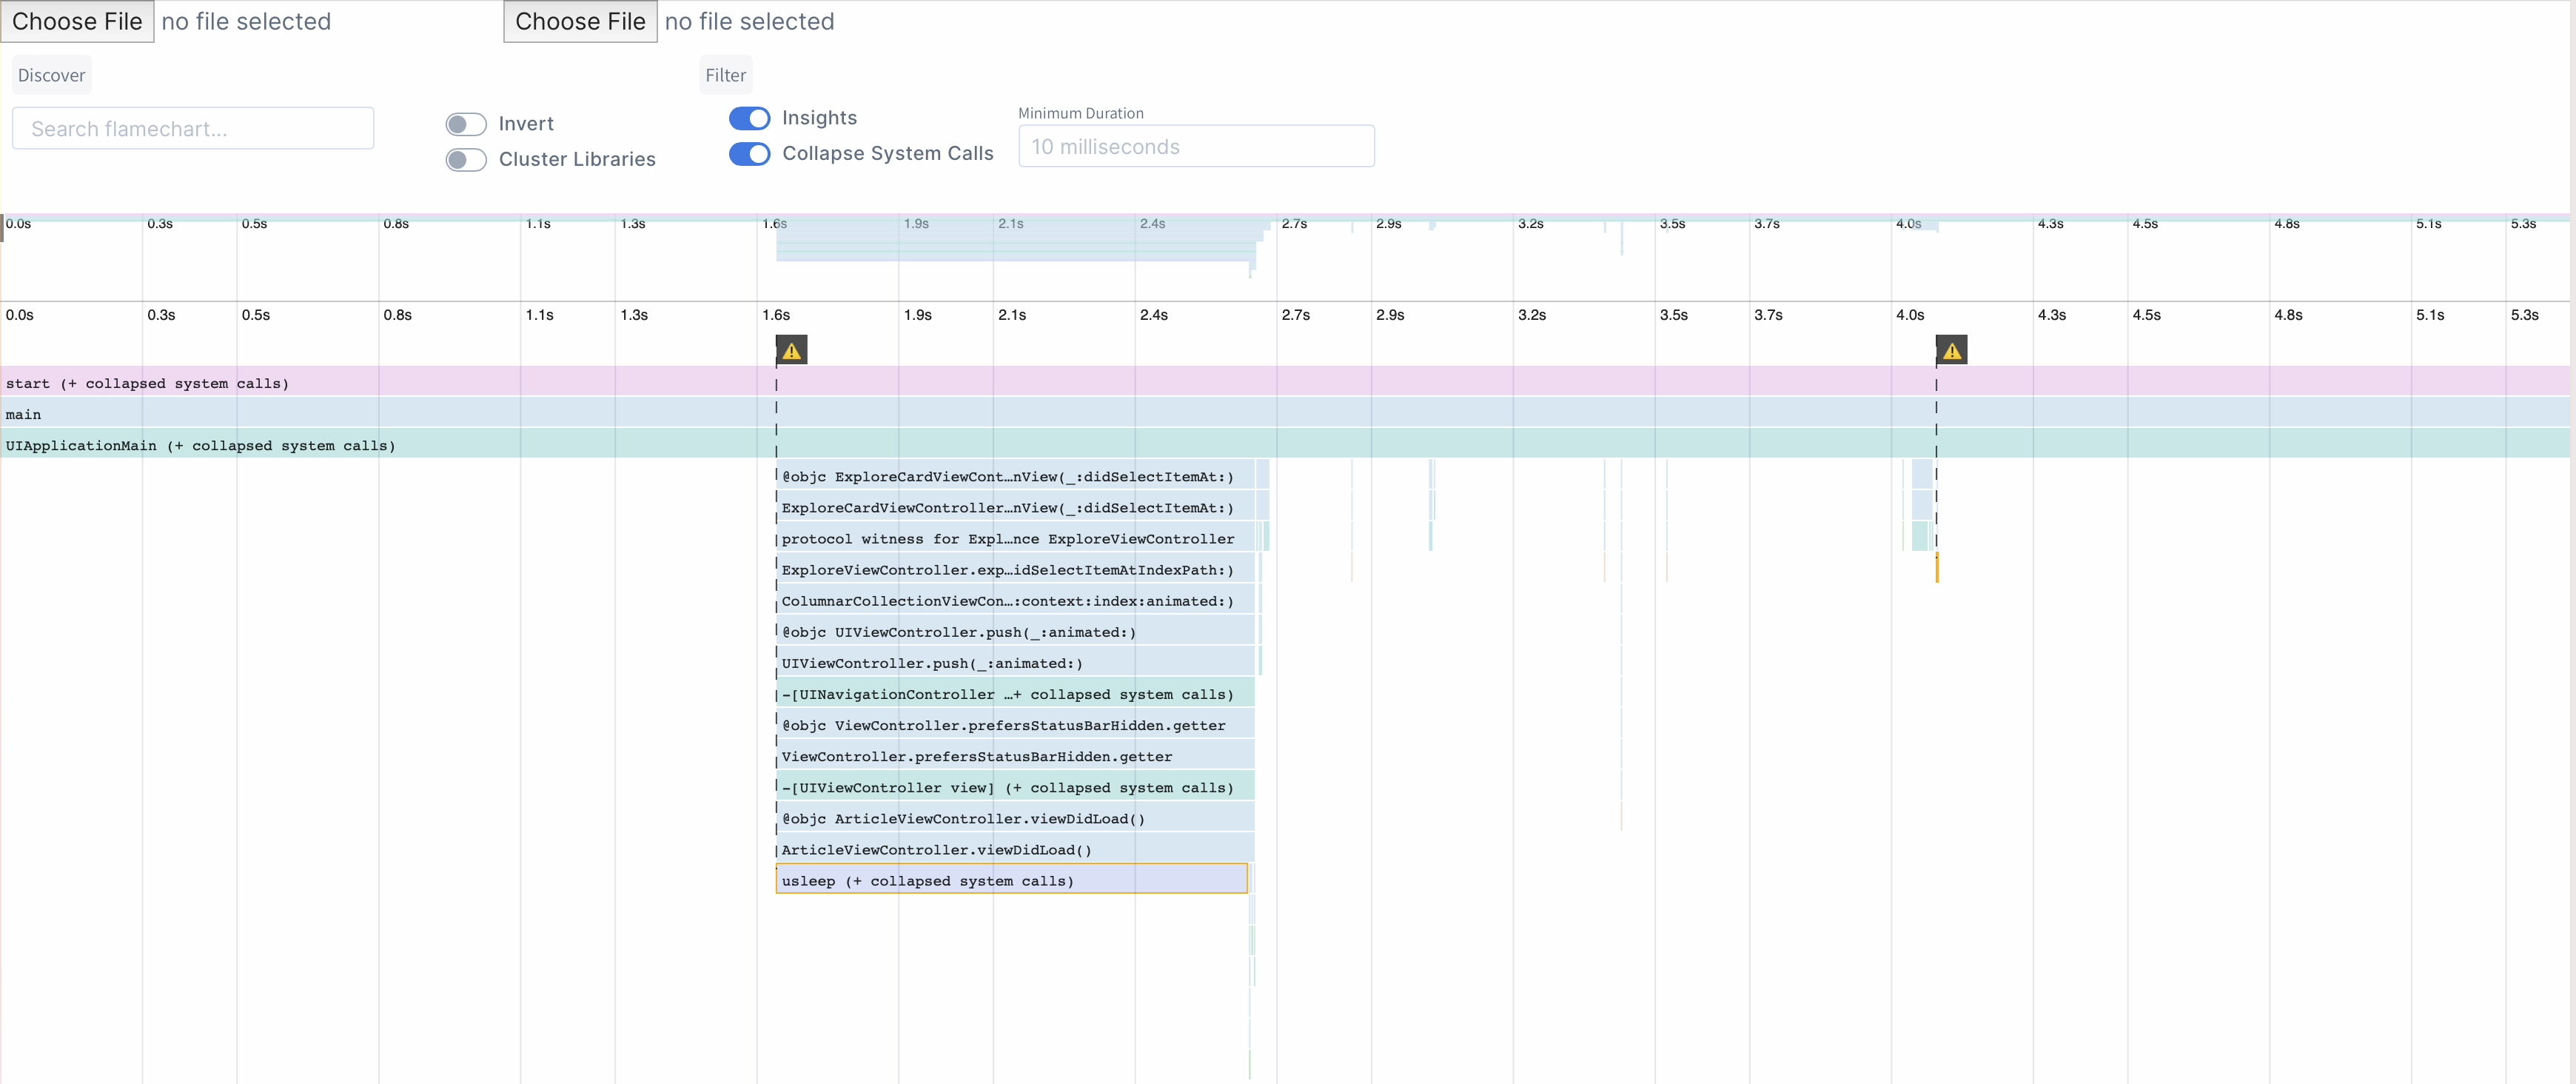
Once installed, the CLI communicates with the SDK running on your device or simulator to generate flame charts. At any point while your app is in use, the CLI can record a trace viewable on https://emergetools.com/ettrace. There's no need to perform any setup such as restarting the app or building with different flags.

Example of the flamechart for local debugging of a hang in the Wikipedia app
Updated 3 months ago
